The LinkedIn Reports section allows you to view metrics related to LinkedIn such as:
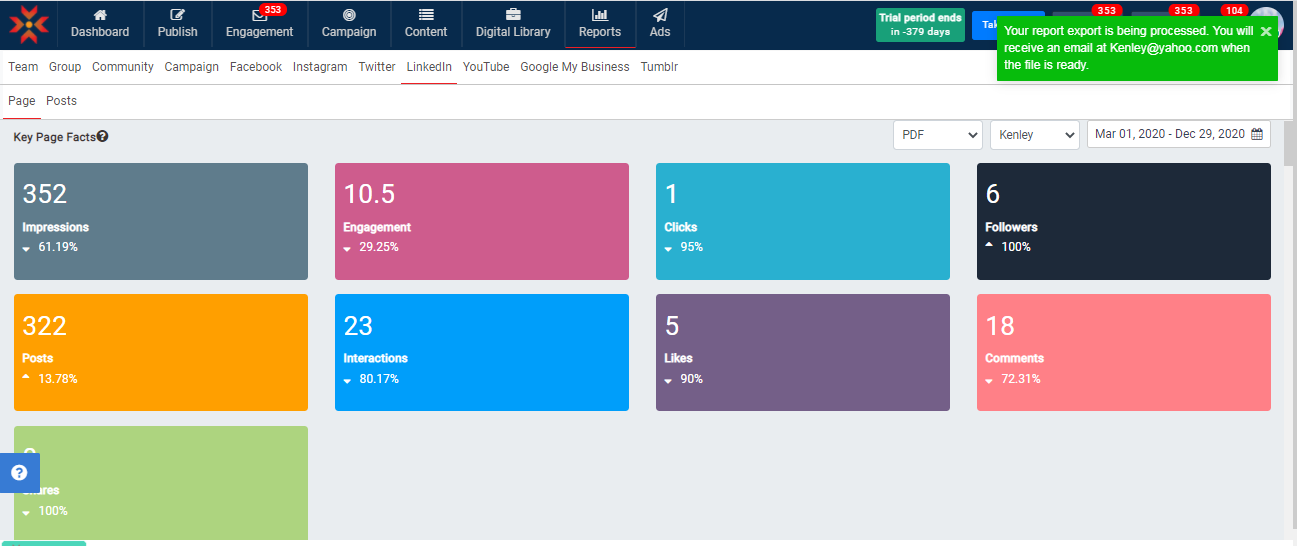
- Key Page Facts
- Likes & Comments
- Shares & Clicks
- Reach
- Followers and Engagement
- Engagement by Seniority Level
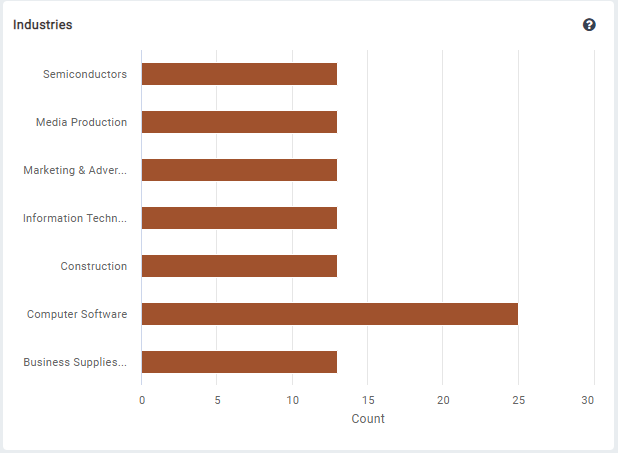
- Engagement by Industry
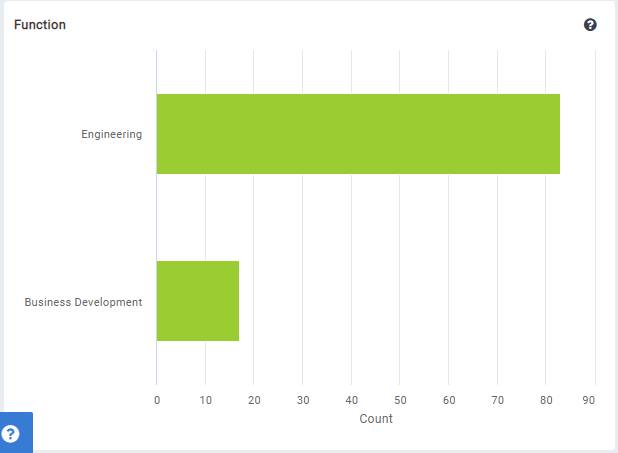
- Engagement by Job Function
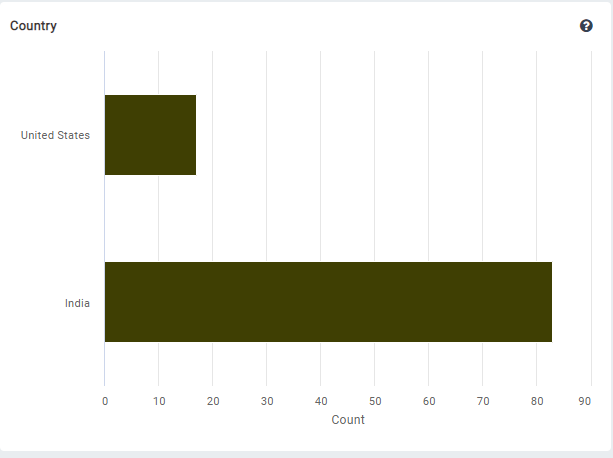
- Engagement by Country
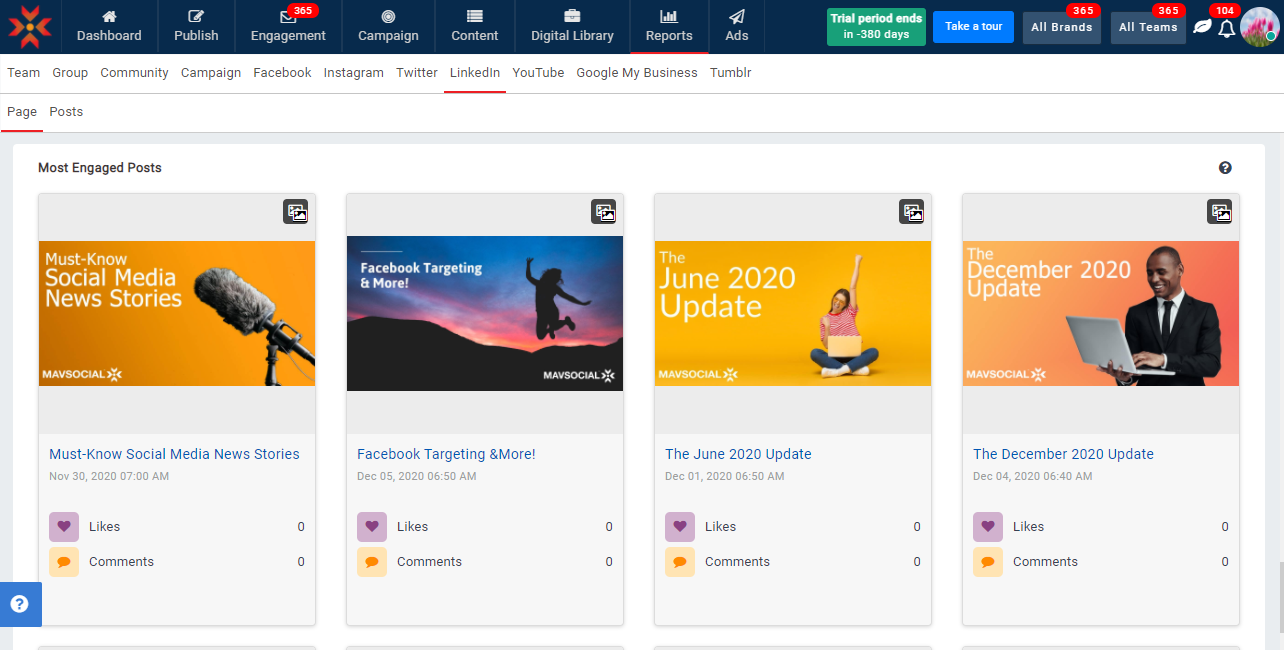
- Most Engaged Posts
Note: The LinkedIn API provides analytics for company page(s) only. Due to this, we are not able to provide any analytics on LinkedIn Main Pages
There are 2 tabs in LinkedIn reports:
- Report
- Posts Report
In the Report tab, there are multiple sections
Key Page Facts - This shows the following details:
-
Impressions: Total number of times each update was shown to LinkedIn members
-
Engagement: Total number of interactions, clicks, and followers acquired divided by the number of impressions
-
Clicks: Total number of clicks on your content company name or the logo this doesn't include interactions or followers acquired
-
Followers: Total number of followers for your Company page from the account creation date
-
Posts: Total number of posts that you made in the selected period
-
Interactions: Total number of likes, comments, and shares in the selected period
-
Likes: Total number of likes for your posts in the selected period
-
Comments: Total number of comments for your posts in the selected period
-
Shares: Total number of times members have shared your posts in the selected period
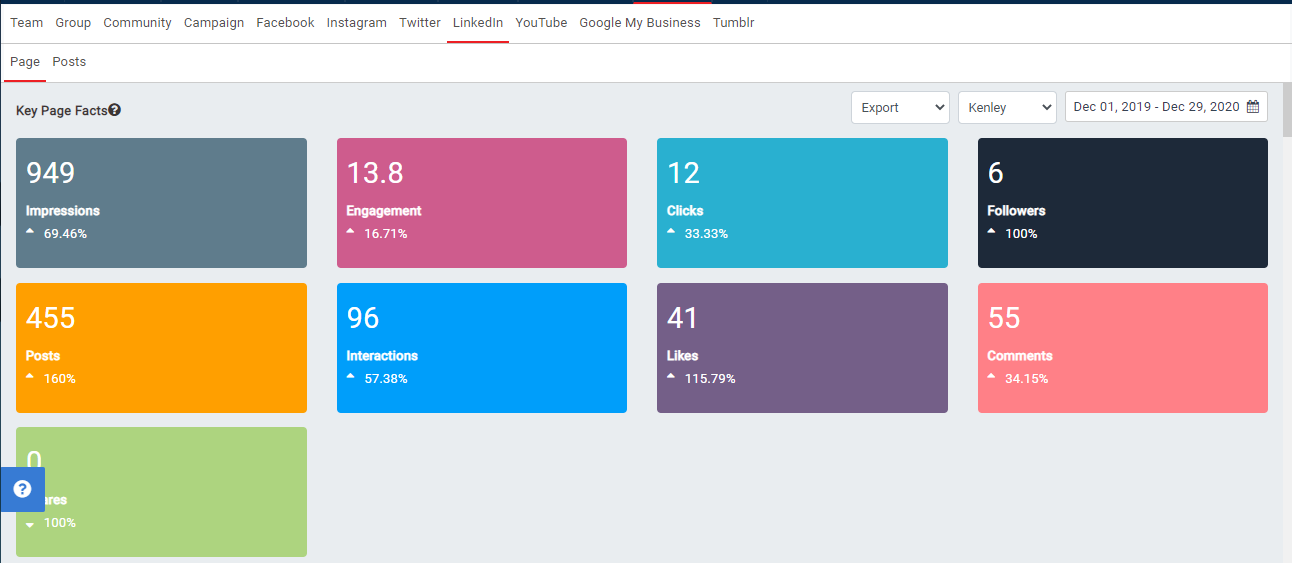
Likes & Comments- this displays Likes & Comments in the selected time period.

Shares & Clicks - Displays shares and clicks in the selected time period

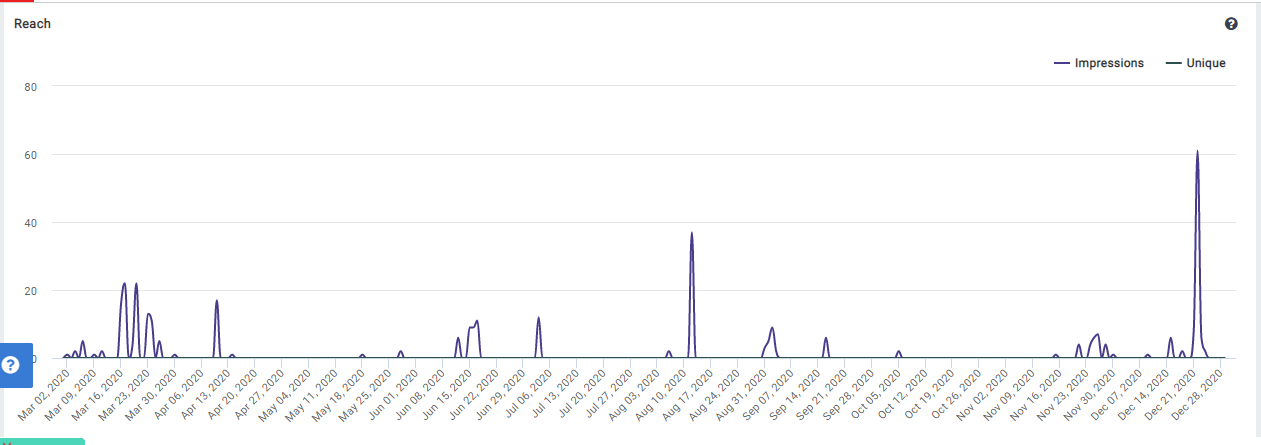
Reach
Impressions: Total number of times your updates were seen on a daily basis by everyone and this includes repeat views.
Uniques: Total number of times your updates were seen on a daily basis by unique members.
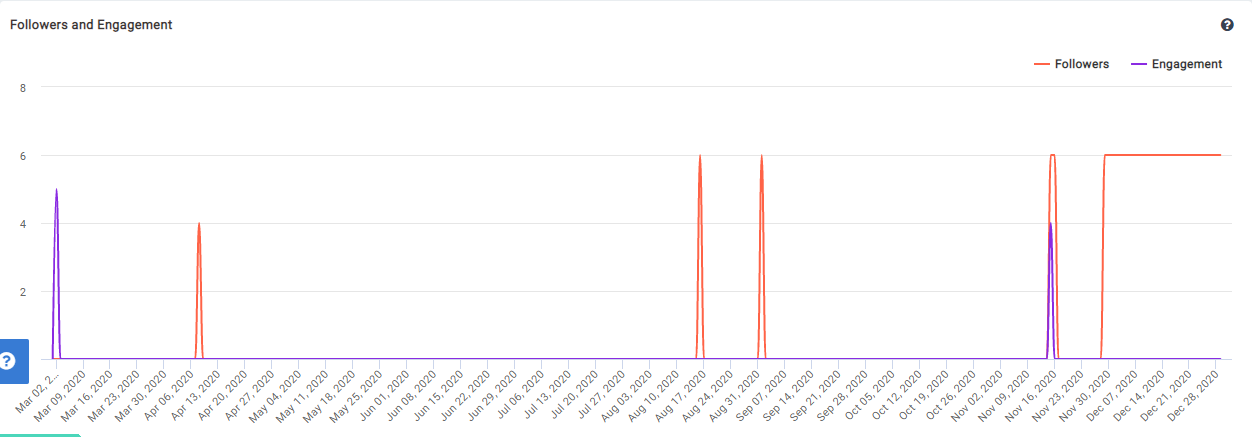
Followers and Engagement - This displays followers trend and engagement in the selected time period.
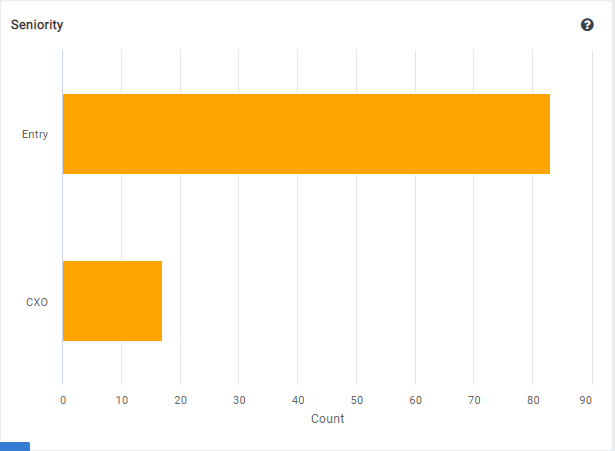
Seniority- Displays post engagement by category from the account creation date.
Industries- Displays post engagement by category from the account creation date
Function- Displays post engagement by category from the account creation date.
Country- Displays post engagement by category from the account creation date.
Most Engaged Posts- Displays the posts that have the highest engagement in the selected period
The LinkedIn Page and Post report sections enable Export as Excel, PDF. When you select Export as Excel, the file will download in the browser, and if you select Export as PDF, it will send the downloaded document to the respective account Email.
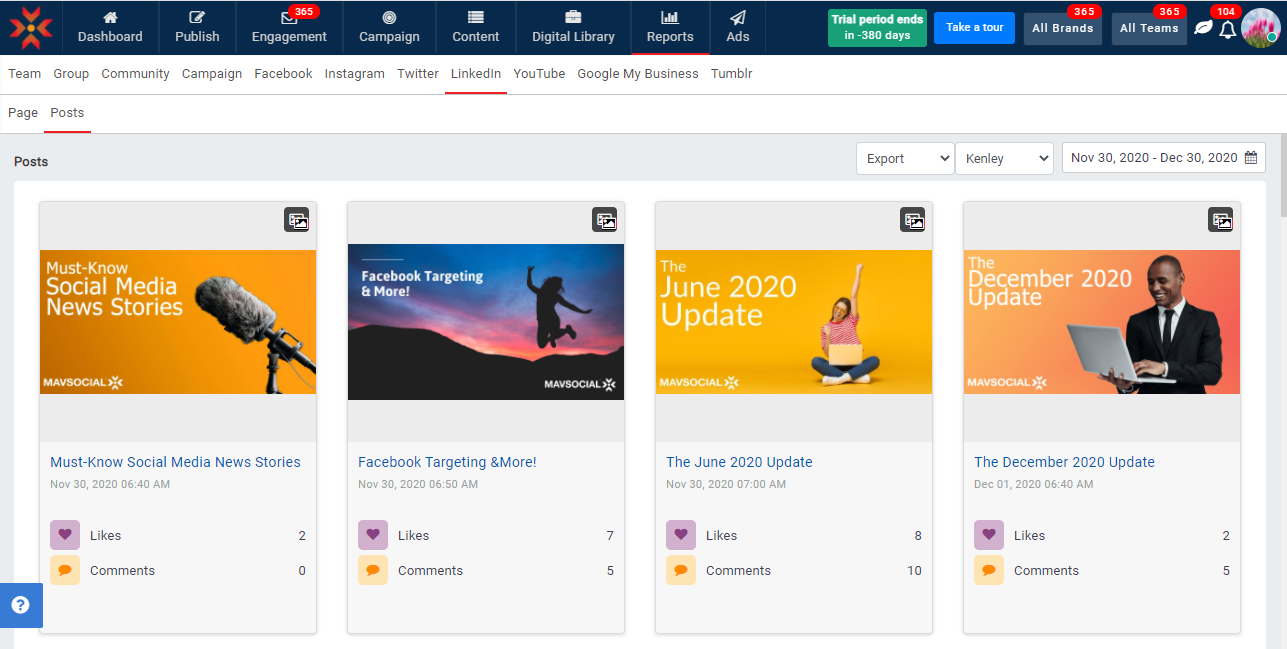
In the Posts Report tab, you can view the details of each post in the selected period.

Comments
0 comments
Please sign in to leave a comment.