The Twitter Ads reports allow you to view your Twitter Ads performance inside MavSocial.
This feature is available for Business and Enterprise users.
To view your Ads metrics, you need to add your Twitter Ad account to MavSocial
Viewing Twitter Ad Reports
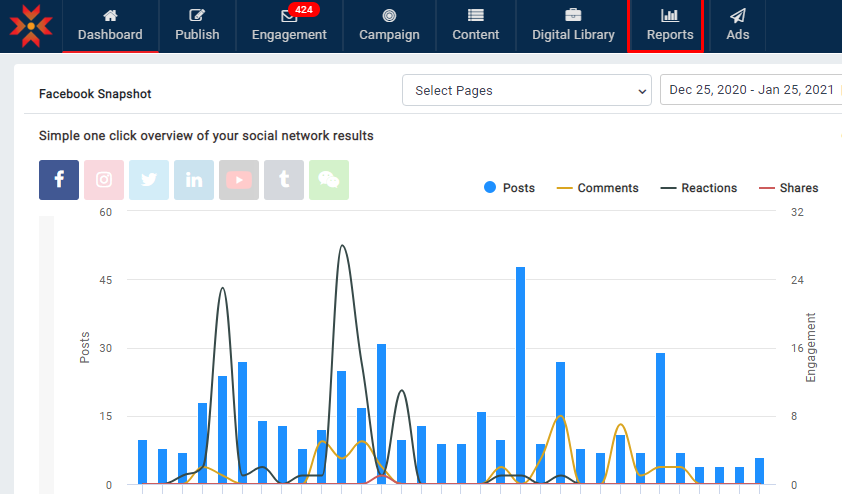
- Navigate to Reports.
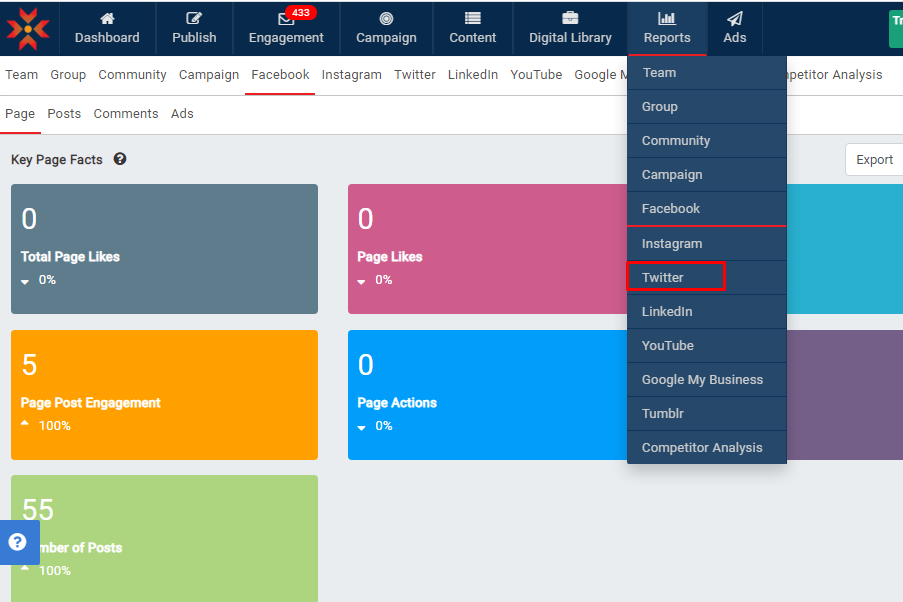
- Click on Twitter.
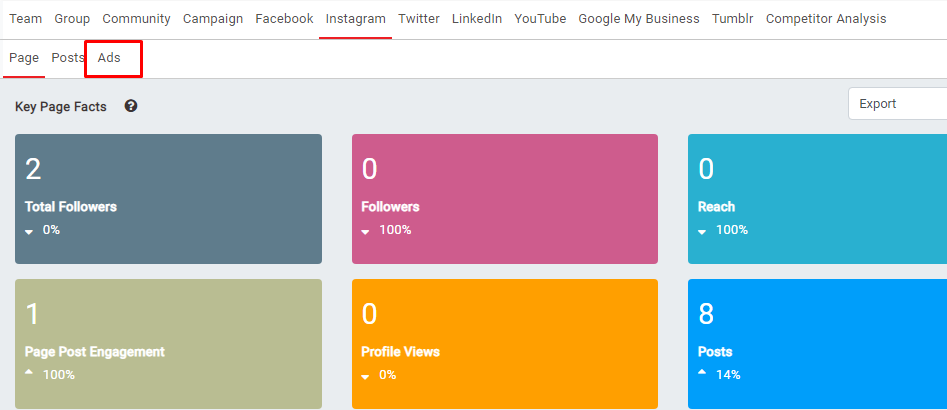
- Clicks on the Ads tab.
- Ad report will be displayed for the last 30 days by default.
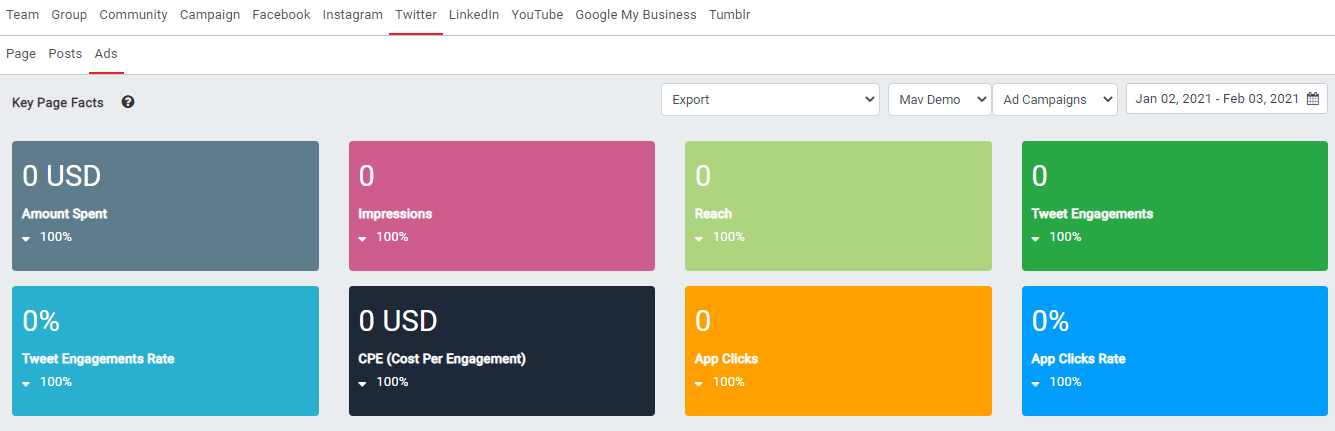
- The date range reported can be changed with the date filter in the top-right corner.
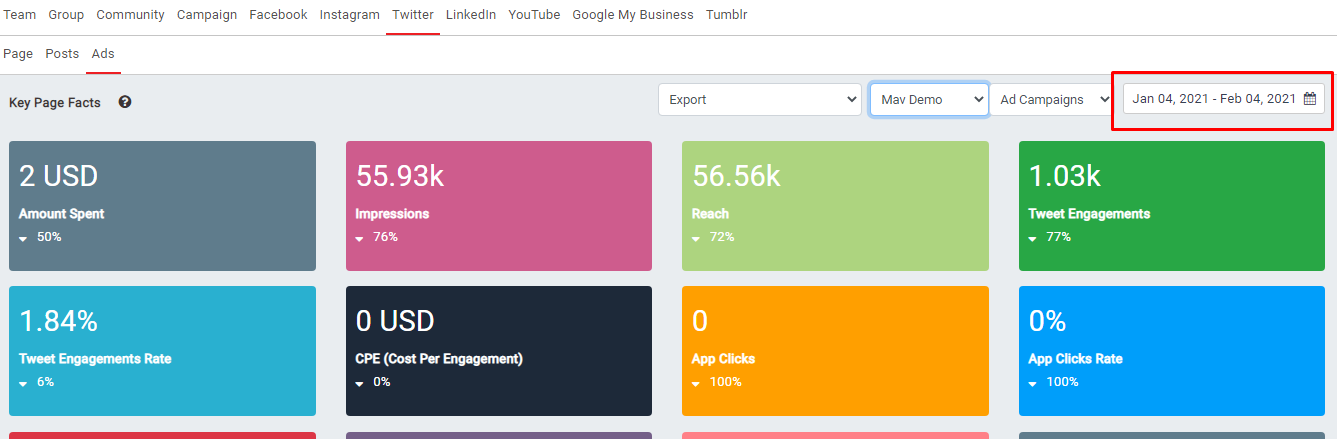
Key Page Facts
- Amount spent: The estimated total amount of money you've spent on your campaign, ad set, or ad.
- Impressions: The number of times your ad is shown to users, including earned.
- Reach: The number of people who saw your ad.
- Tweet engagement: Total interactions with your tweet, including retweets, replies, likes, poll votes, hashtag clicks, and swipes. It includes earned interactions that you're not billed for.
- Tweet engagement rate: Tweet engagements divided by impressions. It helps you understand the engagement rate with your ad.
- CPE (Cost per engagement): Total spend divided by the number of tweet engagements, including earned. You only pay the first time someone engages with your ad (e.g., Retweets, replies, likes, or other clicks).
- App clicks: Total spend divided by the number of Tweet engagements, including earned. You only pay the first time someone engages with your ad (e.g., retweets, replies, likes, or other clicks).
- App clicks rate: Total number of app clicks divided by impressions.
- CPC (Cost per app click): Total spend divided by the number of app clicks, including earned. You only pay the first time someone clicks to install or open your app.
- Video views: Video views only count when your video is watched in 50% view for 2 seconds or more or when a user clicks to expand/unmute your video. It includes views you are not billed for.
- Video views rate: Total video views divided by impressions. Regardless of your bid type, this is always calculated using video ad views.
- CPV (Cost per video view): Total spend divided by the number of views, including earned. You only pay the first time someone watches your video.
- Link clicks: Total clicks on the link or Website Card in your ad, including earned. This includes clicks you're not billed for.
- Link click rate: Total clicks on a link or a Website Card divided by total impressions, including earned.
- CPL(Cost per link click): Total spend divided by the number of link clicks, including earned. You only pay the first time someone clicks on your link or Website Card.
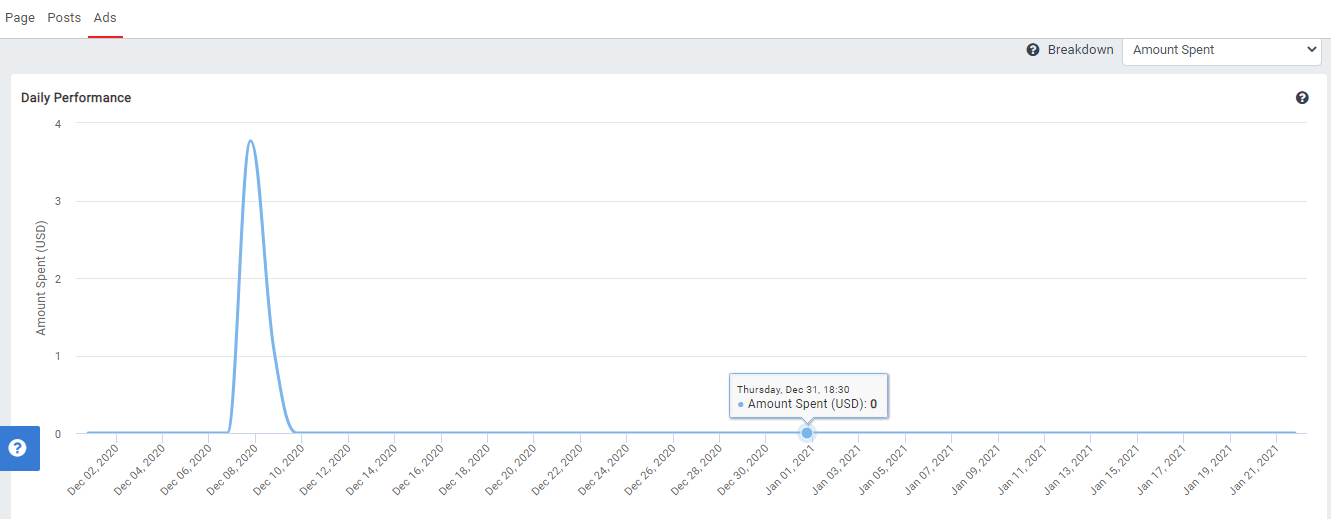
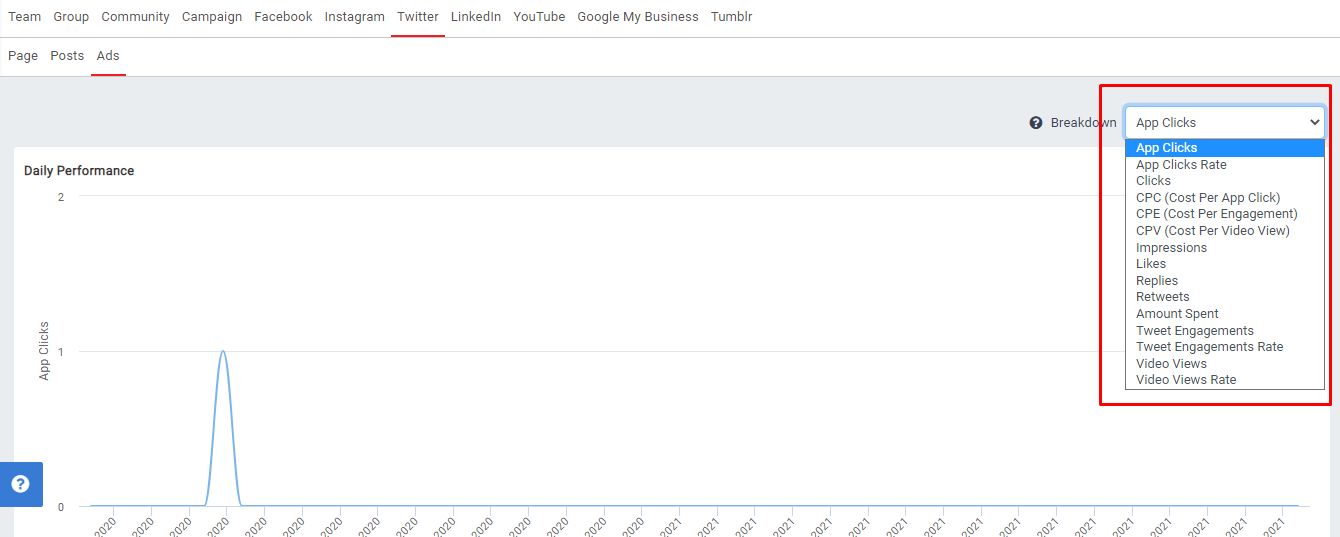
Daily Performance: The Performance chart shows your ad performance based on selected metric.
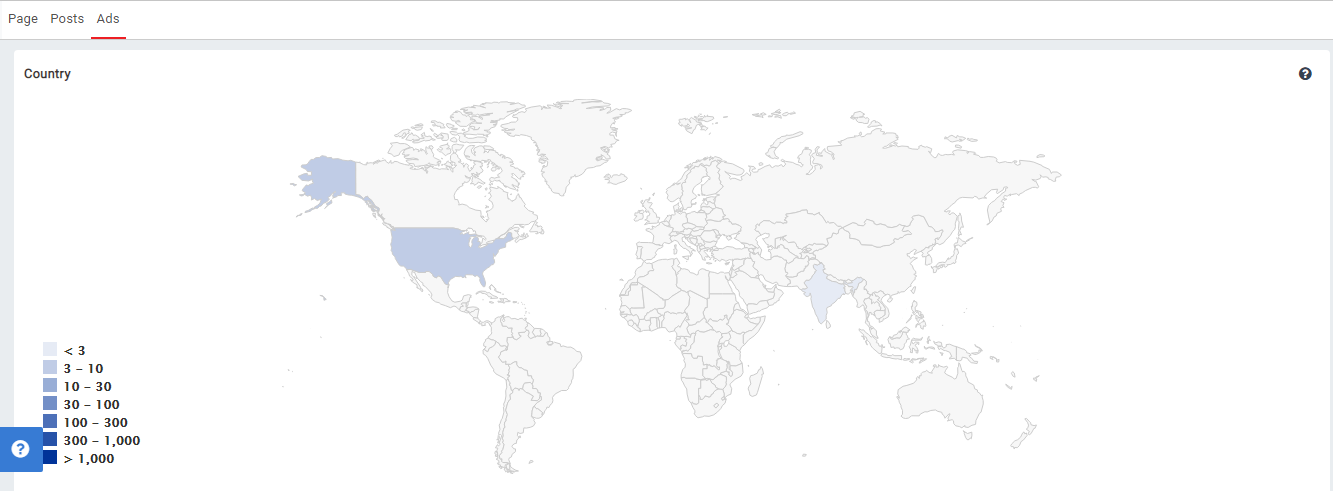
Country: The Country chart shows how your ad performed aggregated per country.
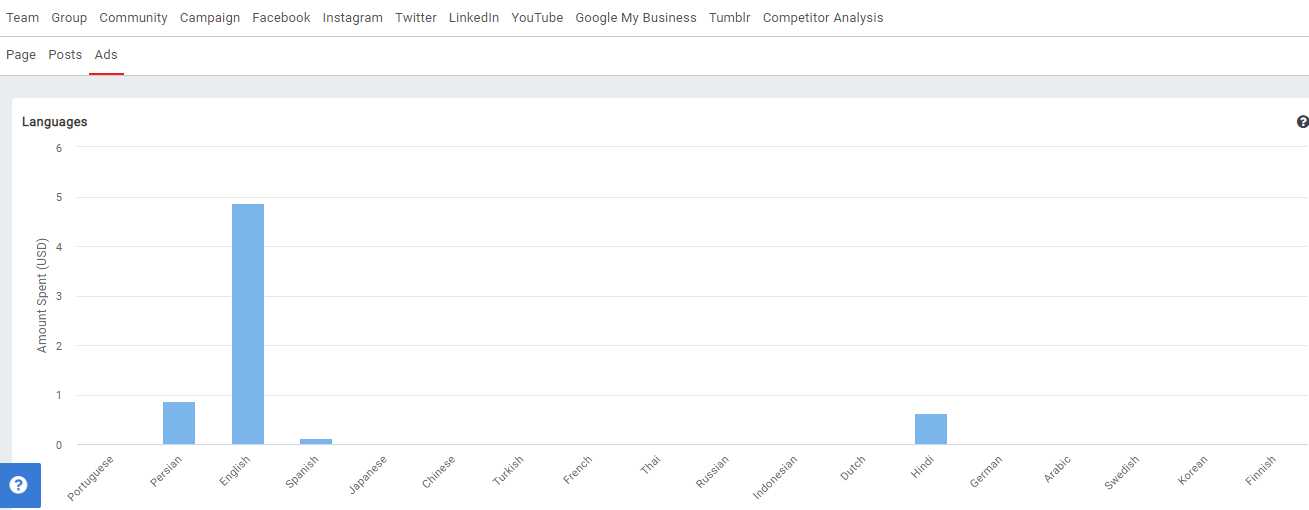
Languages: The languages you targeted, or the languages used by people who engaged with your ad.
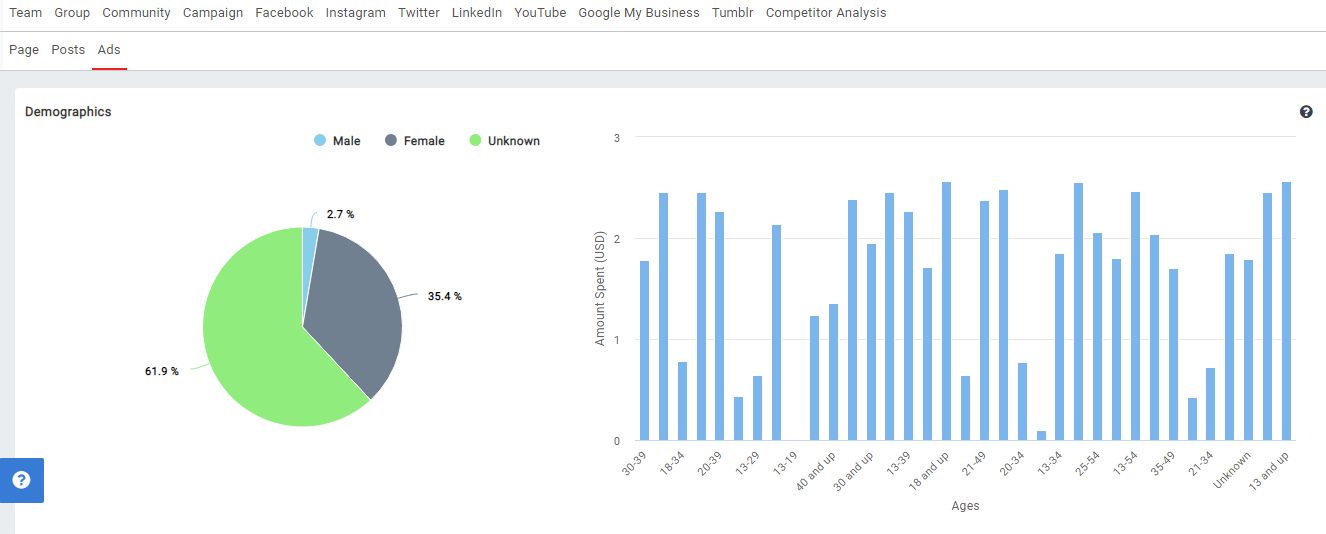
Demographics: The Demographics chart shows how your ad performed across different ages and genders.
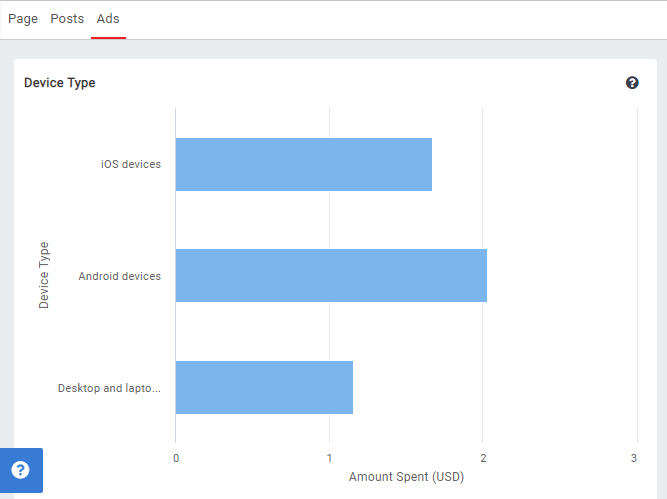
Device Type: The Device Type chart shows the device that people were using when they saw your ads.
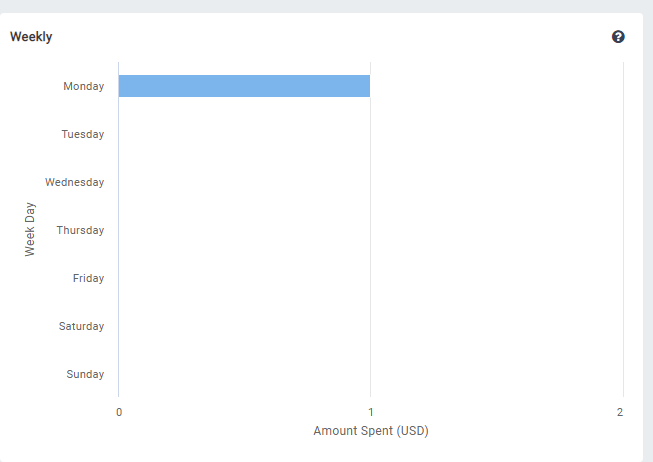
Daily: The Daily chart shows how your ad performed aggregated per day.
- The campaigns table will be displayed with customized metrics.
Note:-
Daily performance, Country, Language, Demographics, Device type, Weekly graphs will show based on selected value in Breakdown.
- You will get Ad report metrics for the following objectives.
- App installs,
- Engagement
- Video views
- Website clicks
Comments
0 comments
Please sign in to leave a comment.