The Facebook Reports section allows you to view metrics related to Facebook, including:
- Key Page Facts
- Page Likes
- Growth of Total Followers
- Page Geographic's
- Cities Of Followers
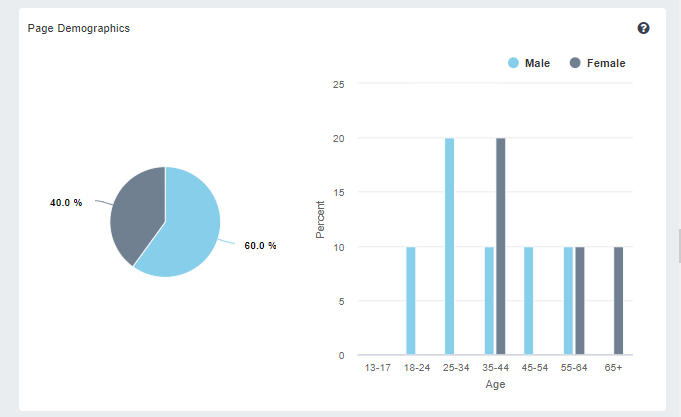
- Page Demographics
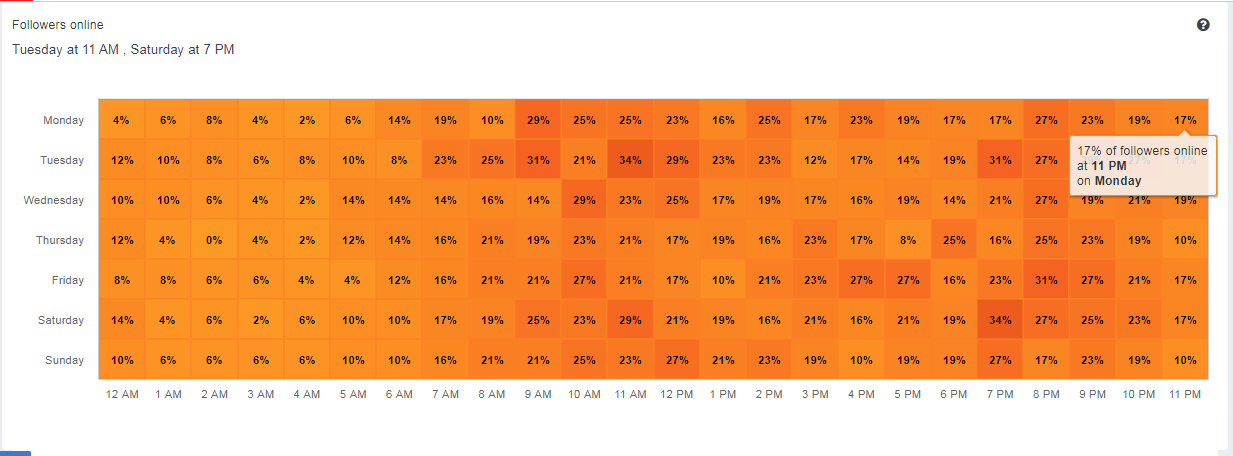
- Followers online
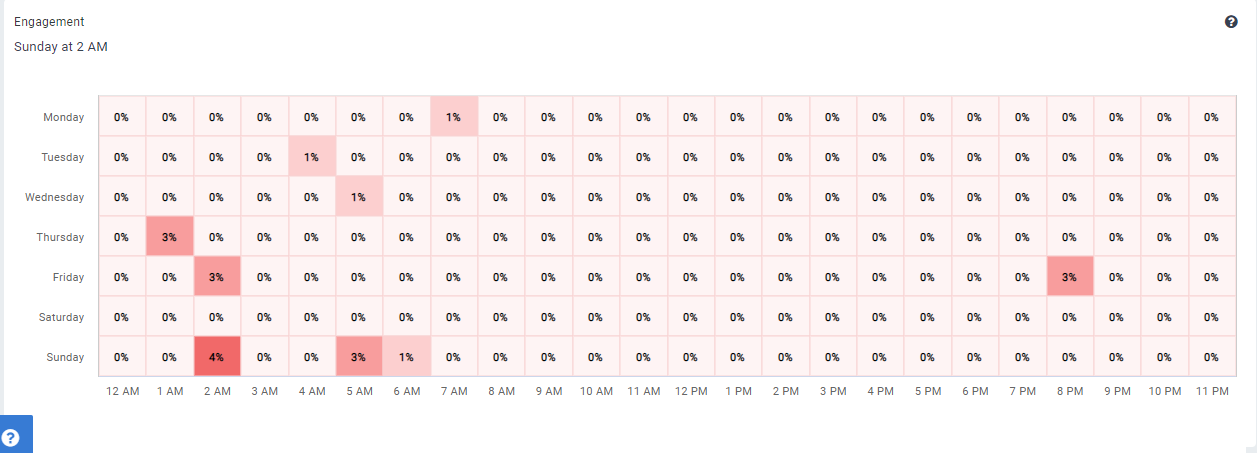
- Engagement
- Post Engagement
- Page Reach
- Post Engagement Rate
- Profile Engagement Rate
- Video Views
- Page Actions
- Top Comments
- Engagement by Post Type
- Most Engaged Posts.
Note: To obtain the above metrics, your Facebook page needs to have at least 30 likes.
There are three tabs in Facebook page reports,
- Page
- Posts
- Comments
Page Reports
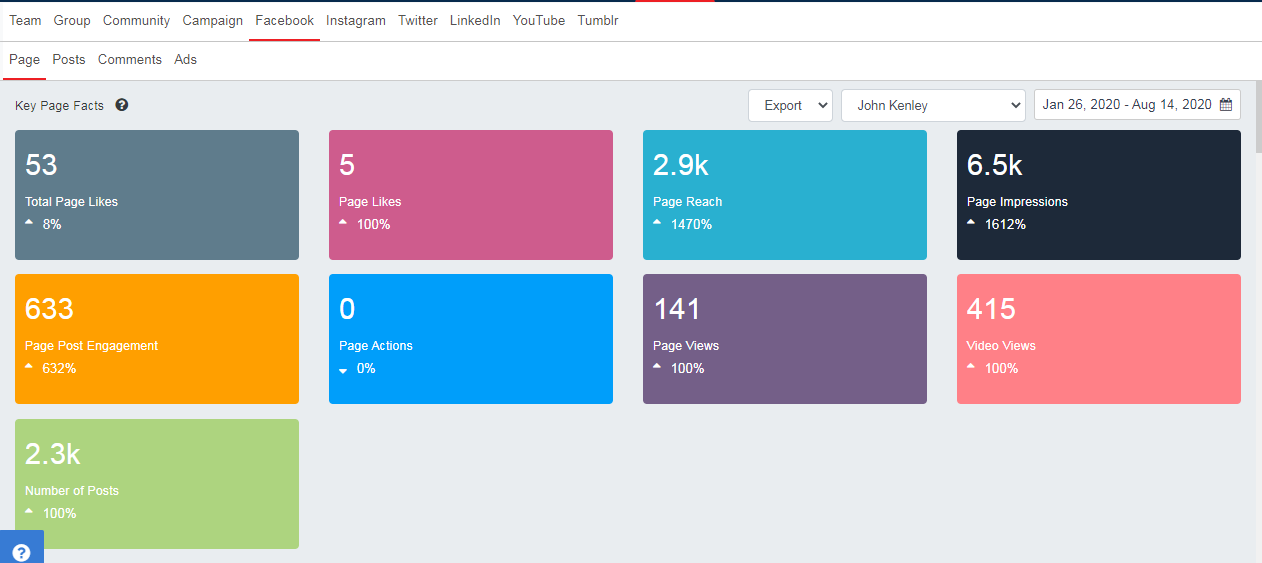
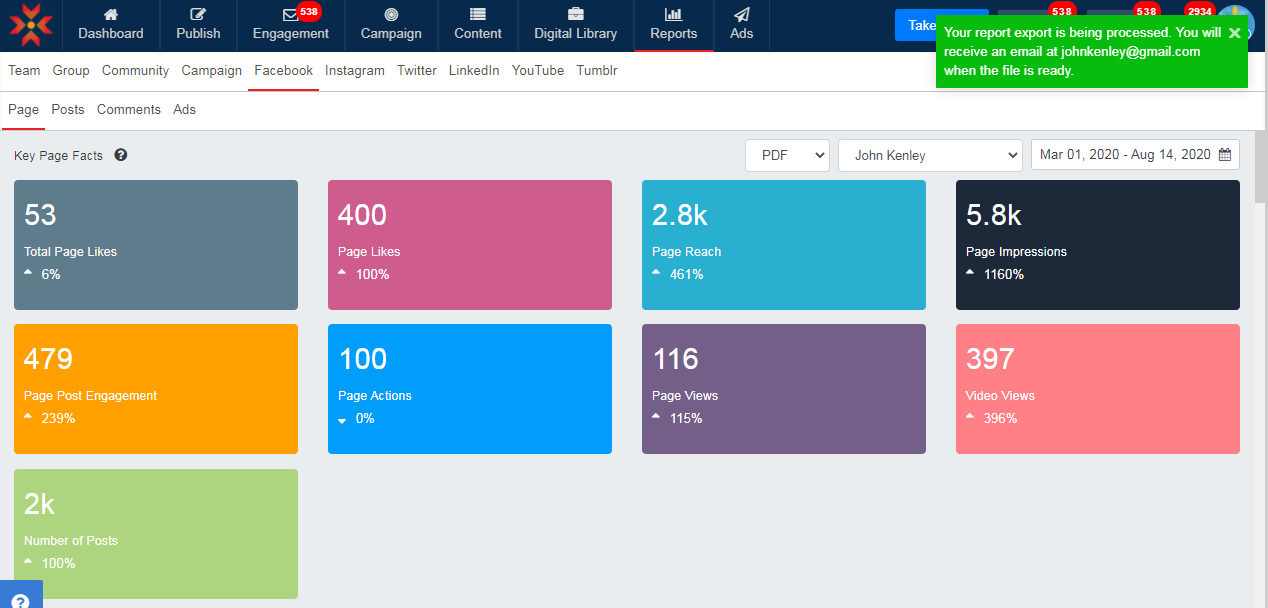
Key Page Facts: Shows the following details:
- Total Page Likes: Total number of likes for your Facebook Page from account creation date
- Page Likes: Difference between new likes and unlikes for your Facebook Page in the selected period
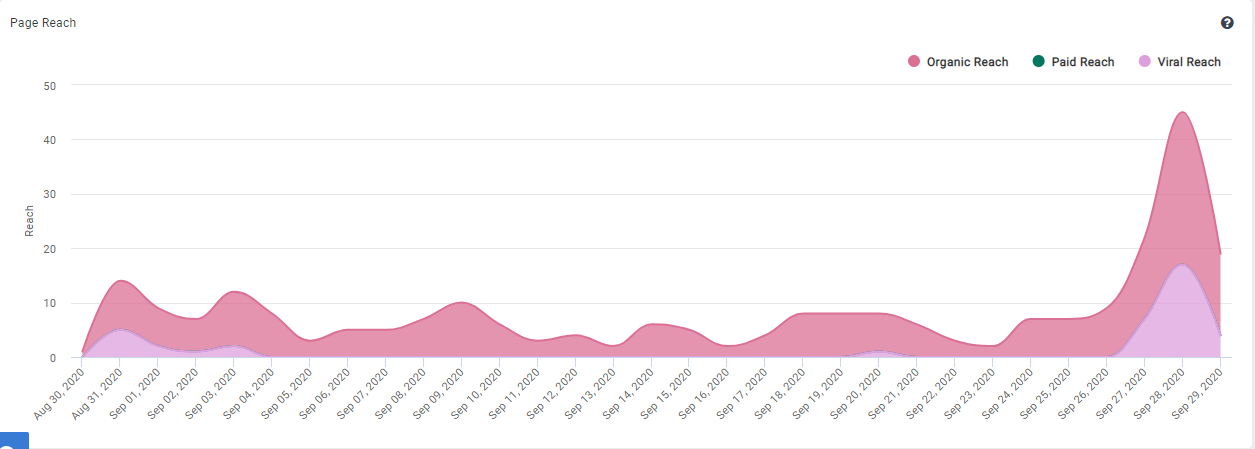
- Page Reach: The number of people who have seen any content associated with your page
- Page Impressions: The number of impressions seen of any content associated with your page
- Page Post Engagement: The number of times people have engaged with your posts through reactions, comments, shares, and more
- Page Actions: The number of clicks on your Page's contact info and call-to-action button
- Page Views: The number of times a Page's profile has been viewed by logged in and logged out people
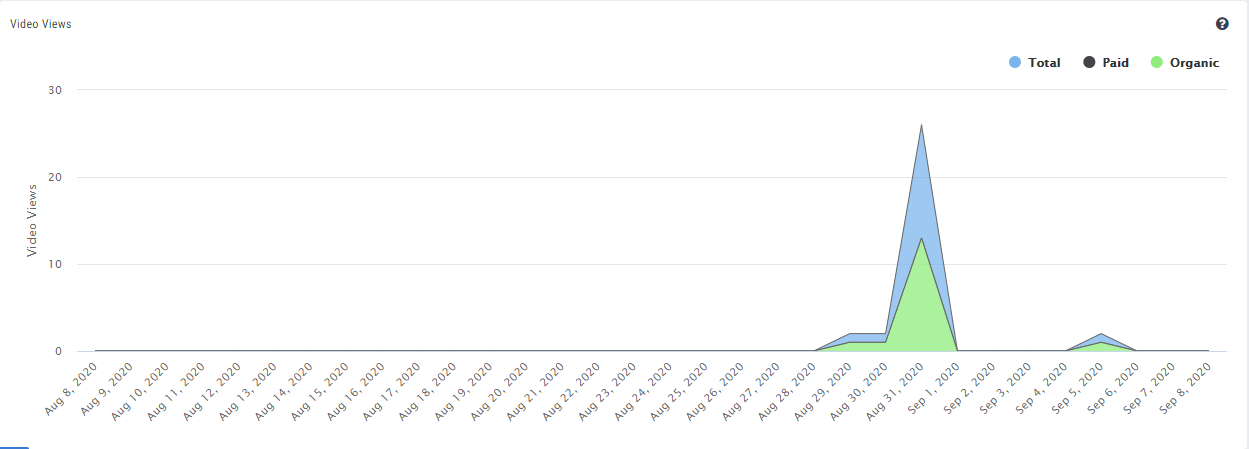
- Video Views: The number of times a Page's videos have been played for unique people for more than 3 seconds
- Number of Posts: Total number of posts that you made during the selected period
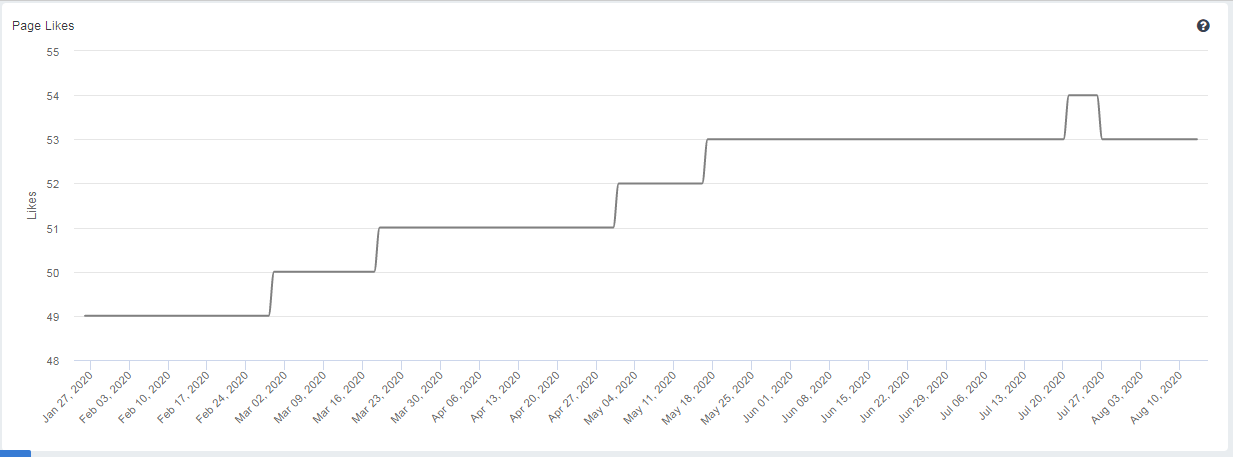
Page Likes: This displays the page likes graph in the selected period.
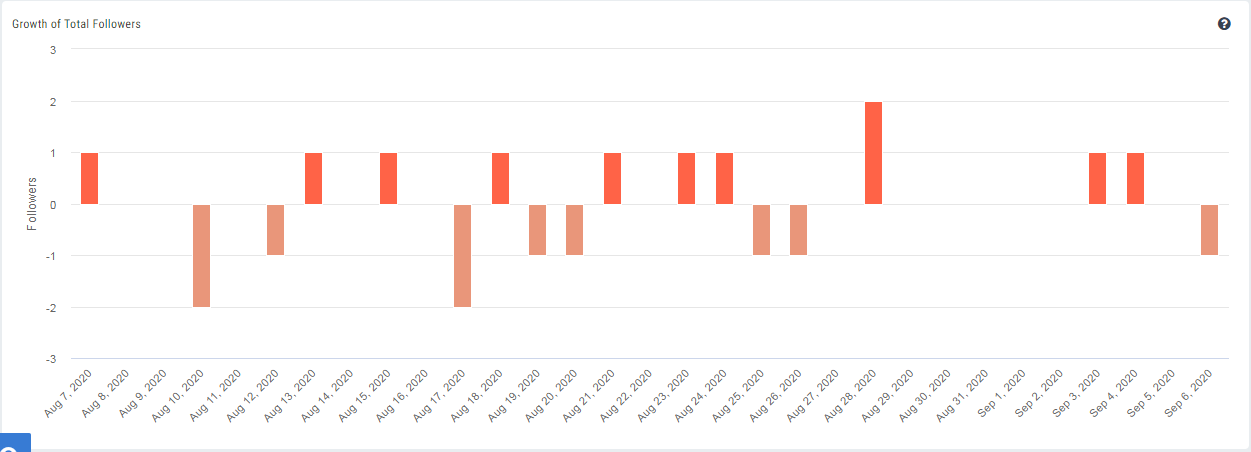
Growth of Total Followers: The increase or decrease in followers during the selected period.
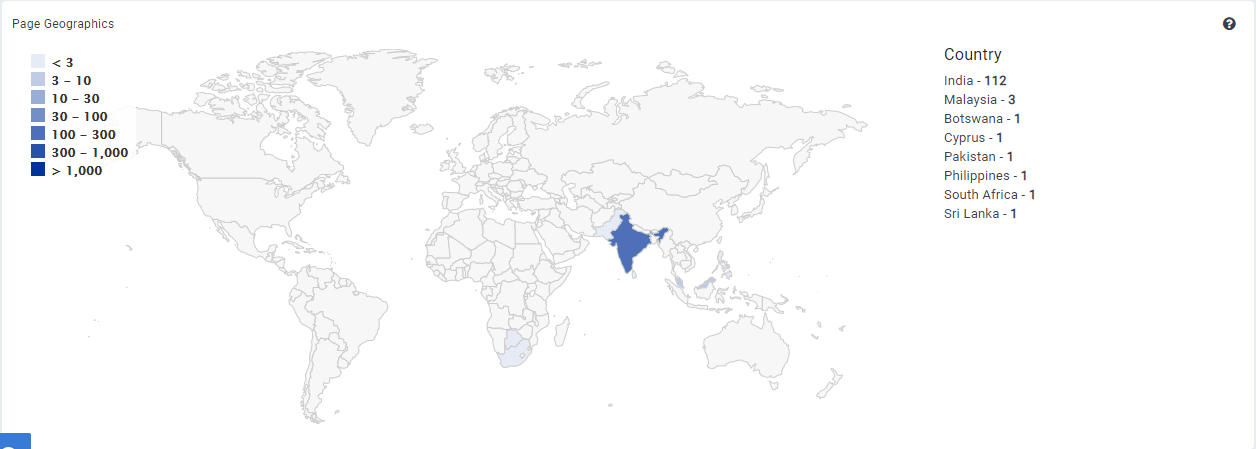
Page Likes Geographic's: This displays the number of people, aggregated per country, who like your Page.
Page Demographics: This displays the aggregated demographic data about the people who like your Page based on the age and gender information they provide in their user profiles
Cities Of Followers: The distribution of cities by followers 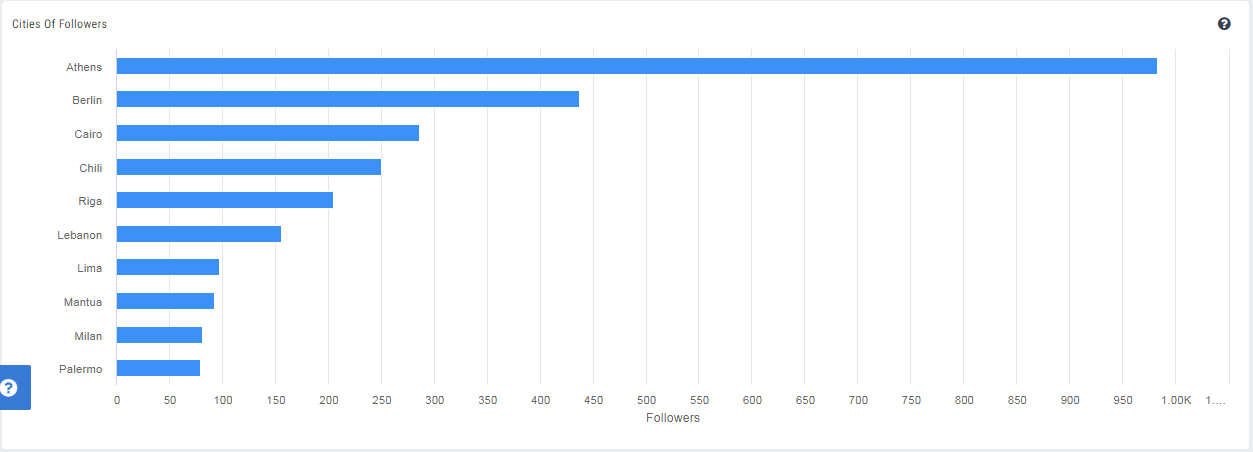
Followers Online: This shows the times of the day and the days of the week when your followers were most active on Facebook during the selected period.
Engagement: This shows when your engagement is the greatest during the selected period.
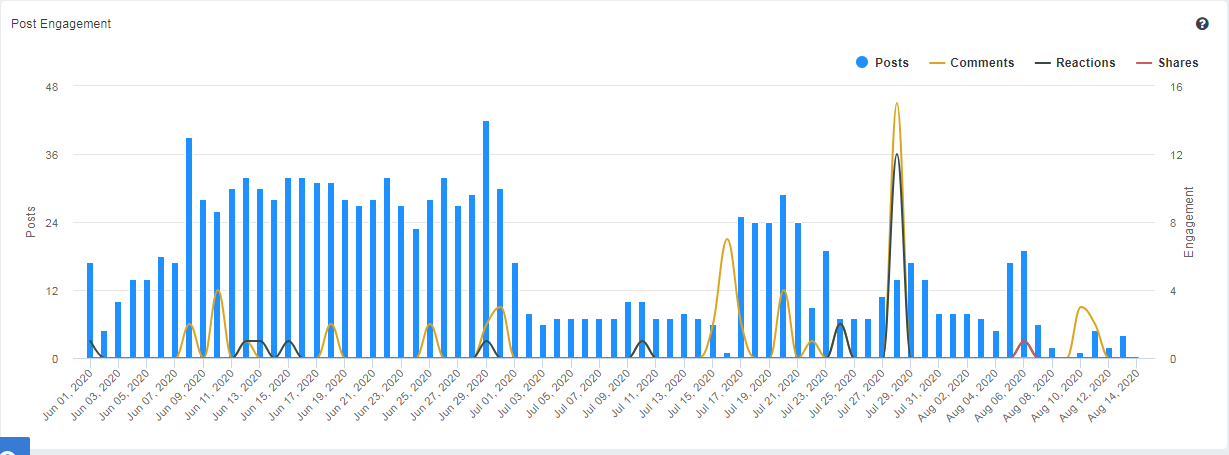
Post Engagement: This shows the following details:
- Engagement: Total number of likes, comments, and shares for your Facebook Page in the selected period
- Posts: Total number of posts per day in the selected period
- Reactions: Total number of reactions (Like, Love, Haha, Wow, Sad & Angry) for your posts in the selected period
- Comments: Total number of comments for your posts in the selected period
- Shares: Total number of times your posts have been publicly shared in the selected period
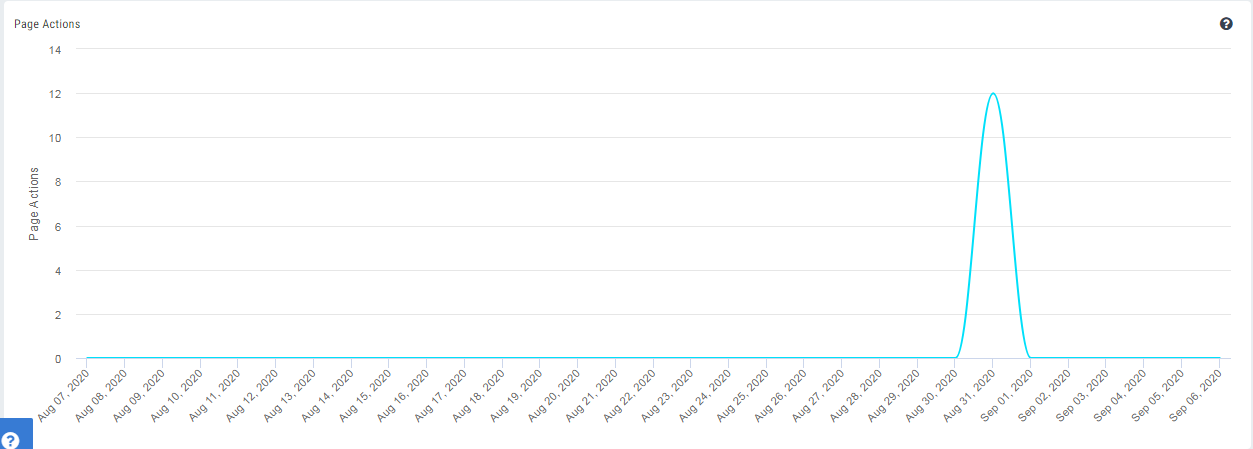
Page Actions: The number of clicks on your Page's contact info and call-to-action button.
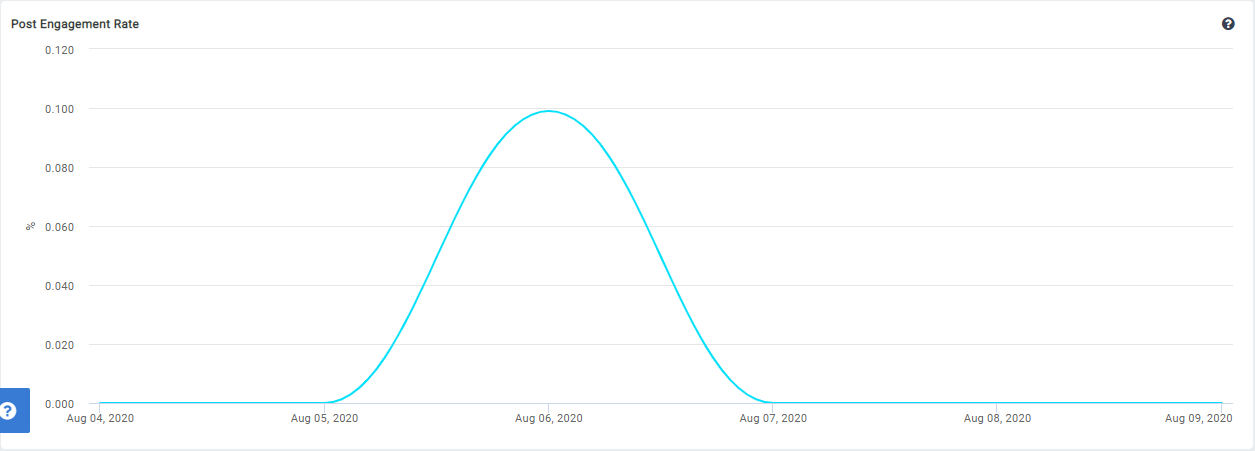
Post Engagement Rate: Calculated as the sum of all likes and comments divided by the number of posts, divided by the number of followers.
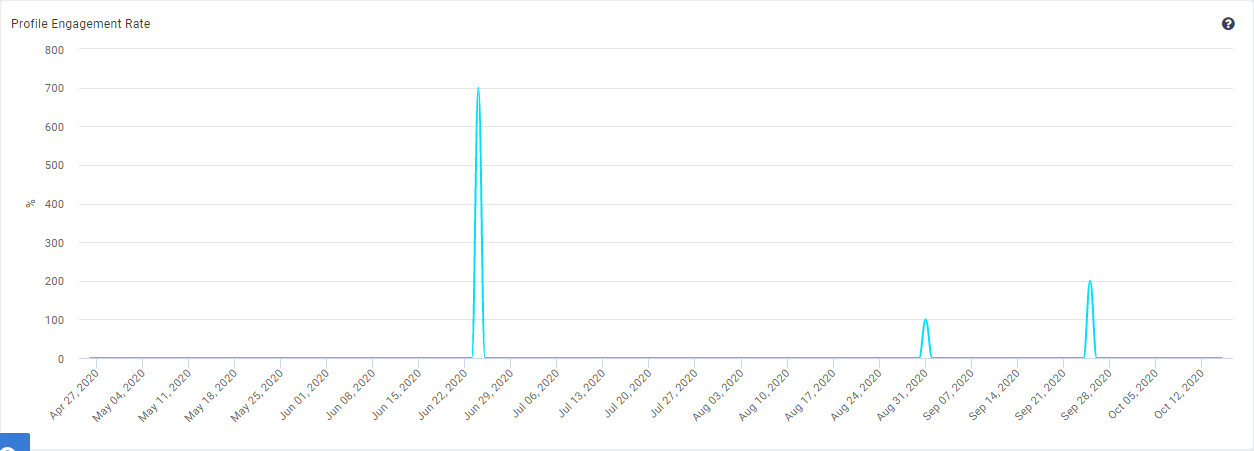
Profile Engagement Rate: Calculated as the number of comments divided by the number of followers during the selected period.
Page Reach: This displays the Page Reach count in the selected period
Video Views: The number of video views per page that occurred within the selected period.
-
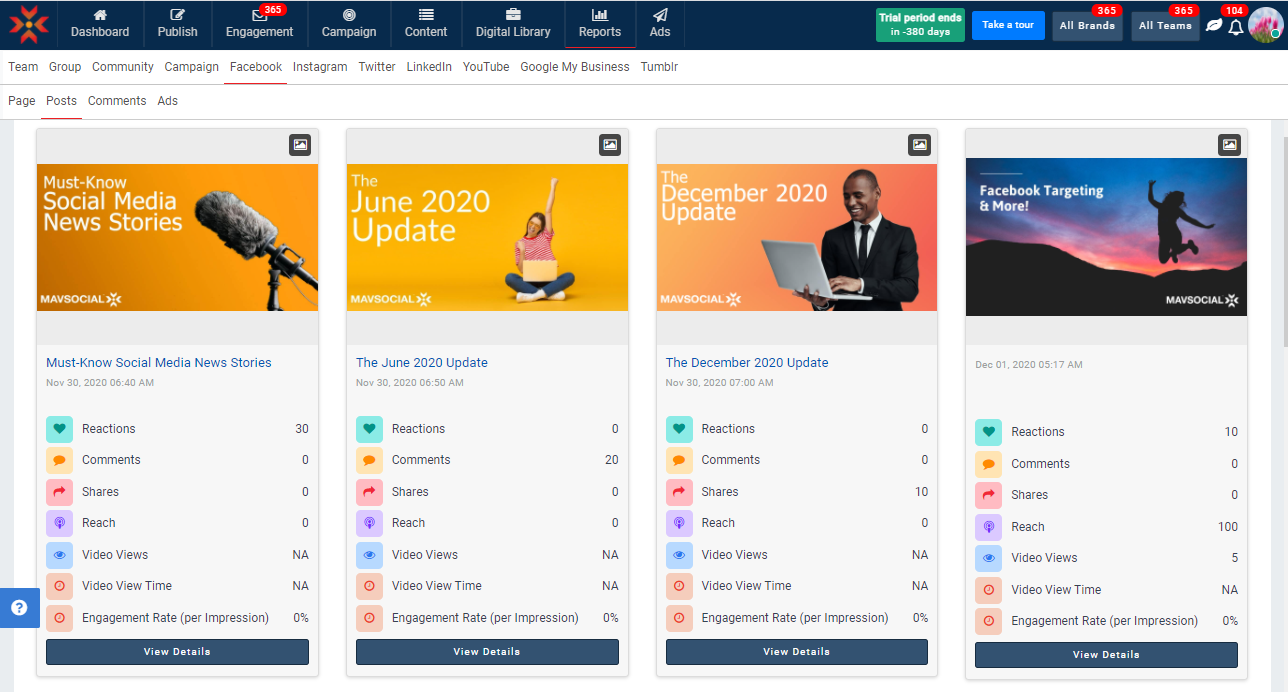
Post Engagement:
- Engagement: Total number of likes, comments, and shares for your Facebook Page in the selected period
- Likes: Total number of likes for your posts in the selected period
- Posts: Total number of posts per day in the selected period
- Reactions: Total number of reactions (Like, Love, Haha, Wow, Sad & Angry) for your posts in the selected period
- Comments: Total number of comments for your posts in the selected period

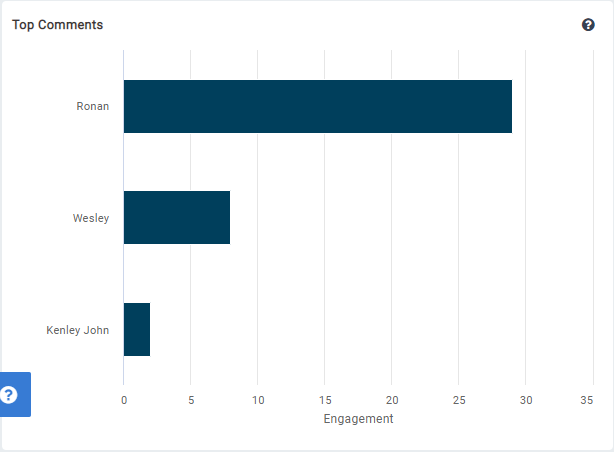
Top Comments: This displays the top 10 people who have engaged most with your posts in the period.
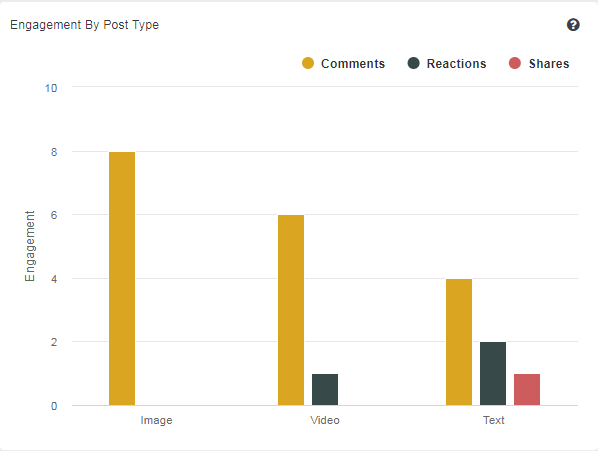
Engagement By Post Type: This displays the average post engagement by type.
Most Engaged Posts: This displays the posts that have the highest engagement in the selected period.
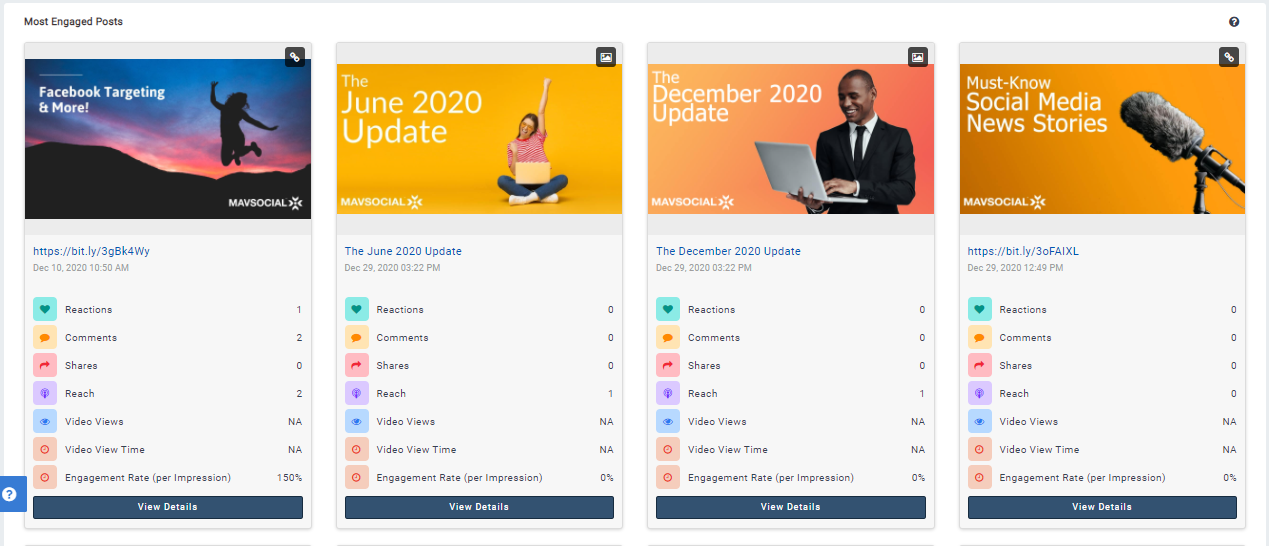
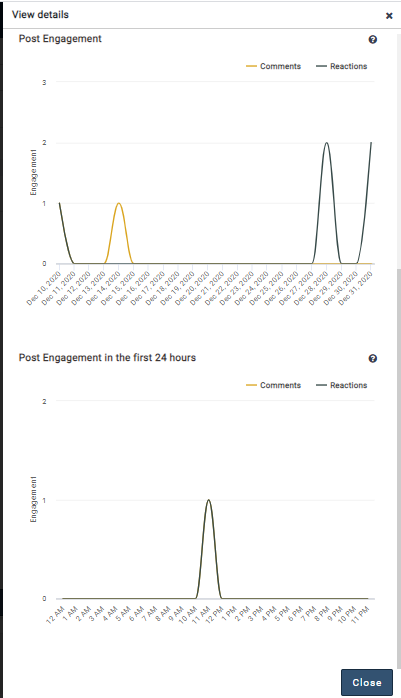
Clicking on the View Details, the following details will be listed.
- Post Comments
- Post Comments in the first 24 hours
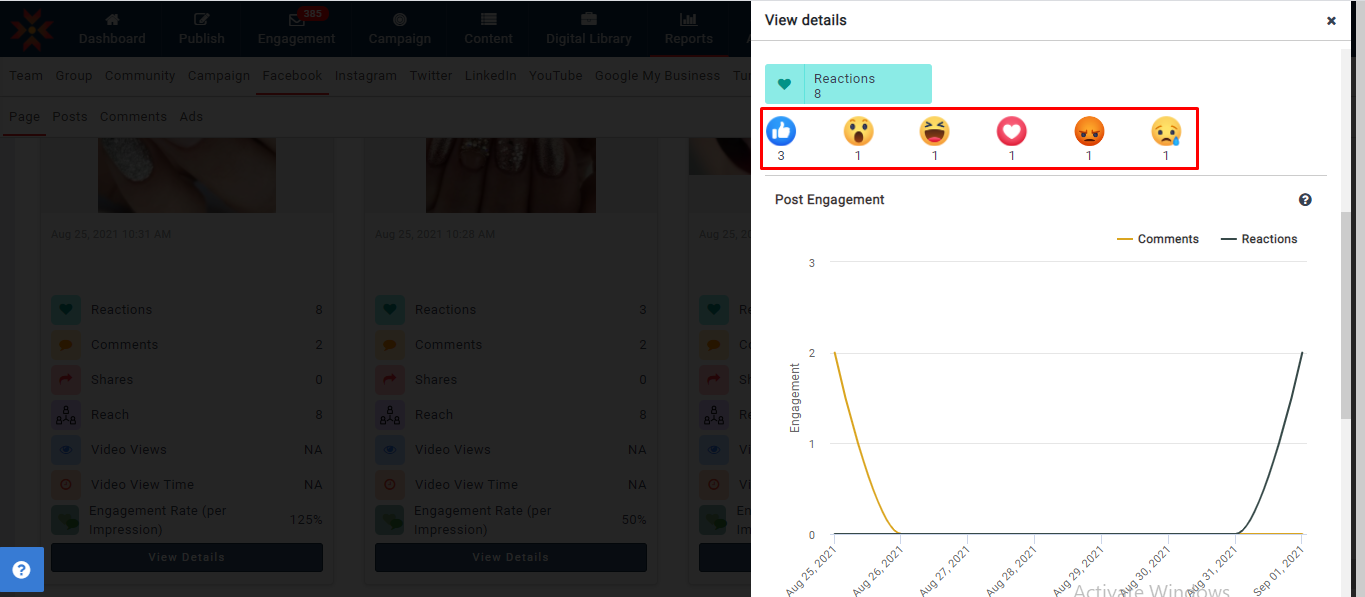
You can also see detailed reactions with the count in View Details.
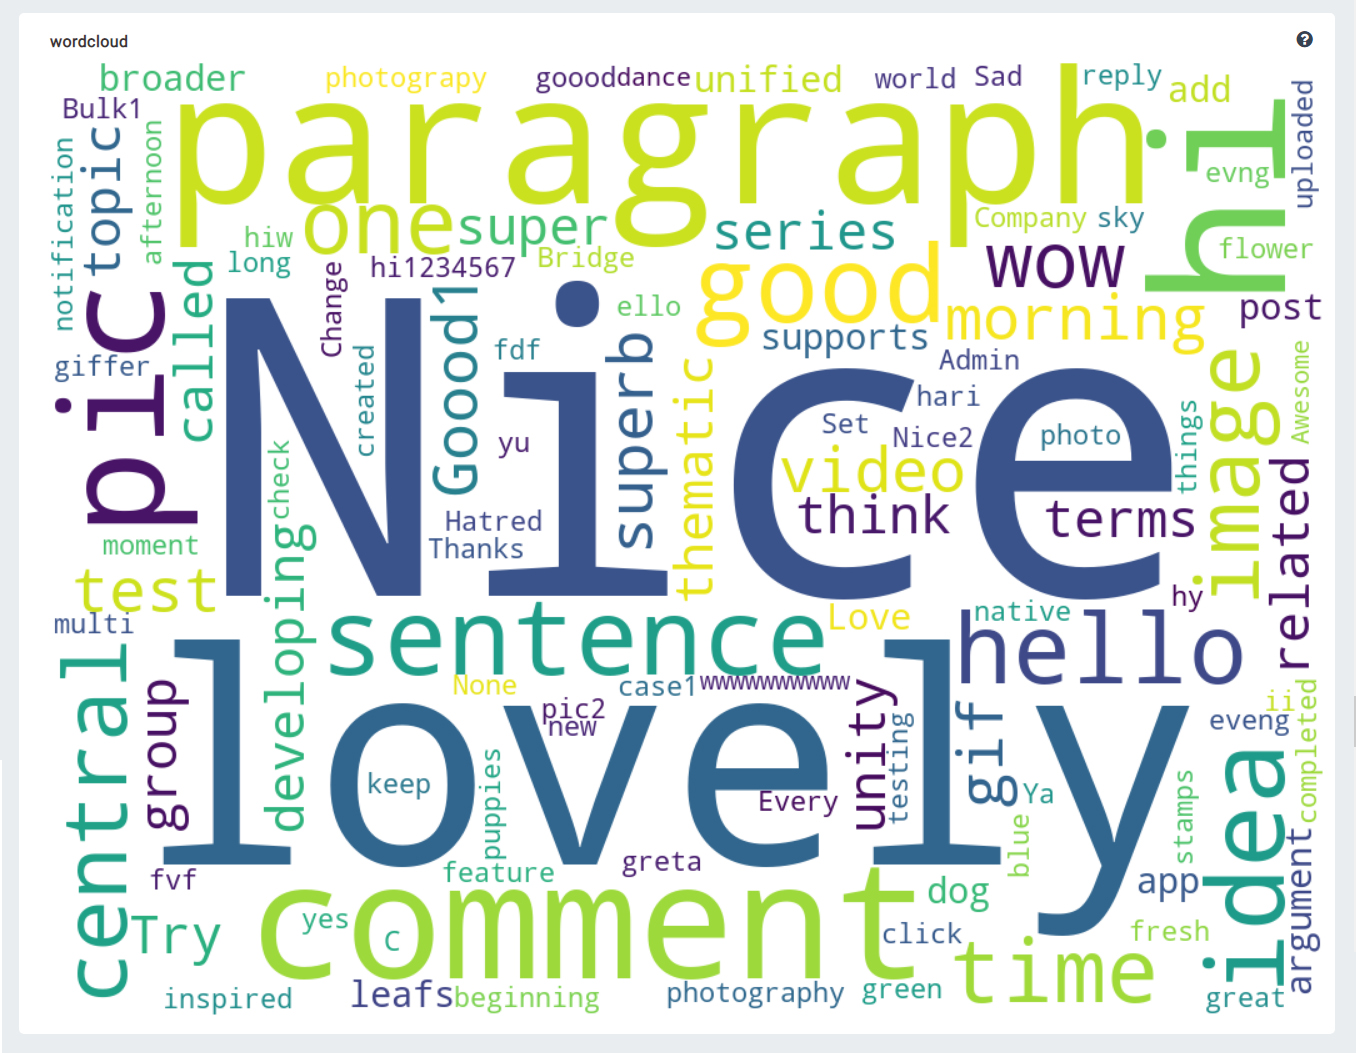
Word Cloud
Word cloud creates an image of the words most frequently used in comments on your posts in the selected period, with the size of each word representing the frequency at which the word appears.
The Facebook Page, Post, and Comments report sections allow export to an Excel or PDF file. When you select export as Excel, the file will download in the browser, and if you choose to export as PDF, it will send the downloaded document to the respective account Email.
In the Posts Report tab, you can view the details of each post in the selected period.
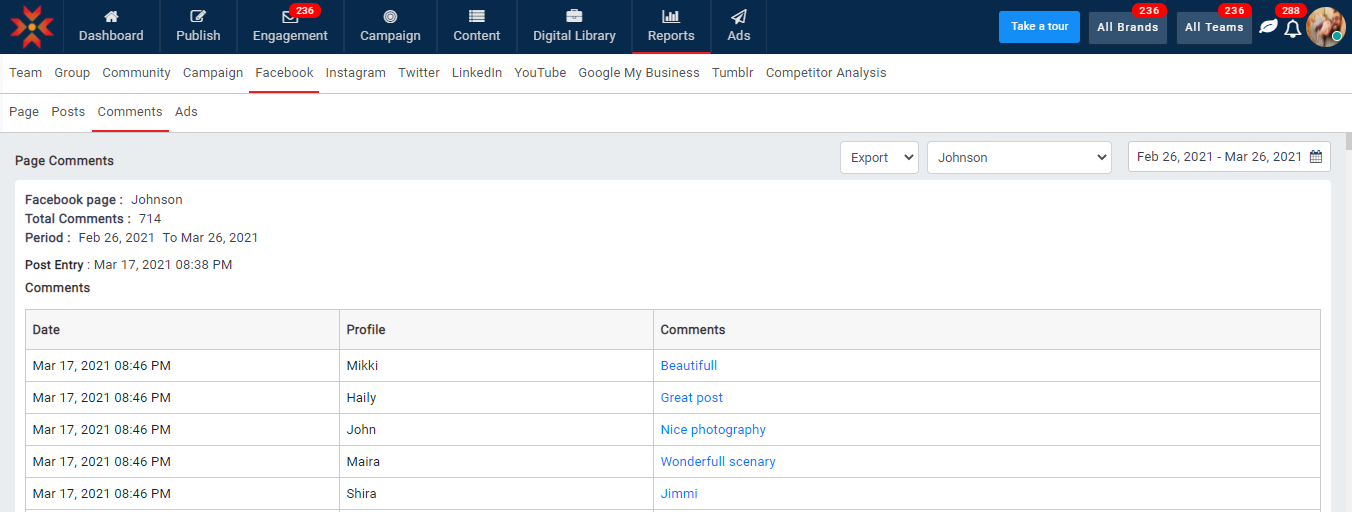
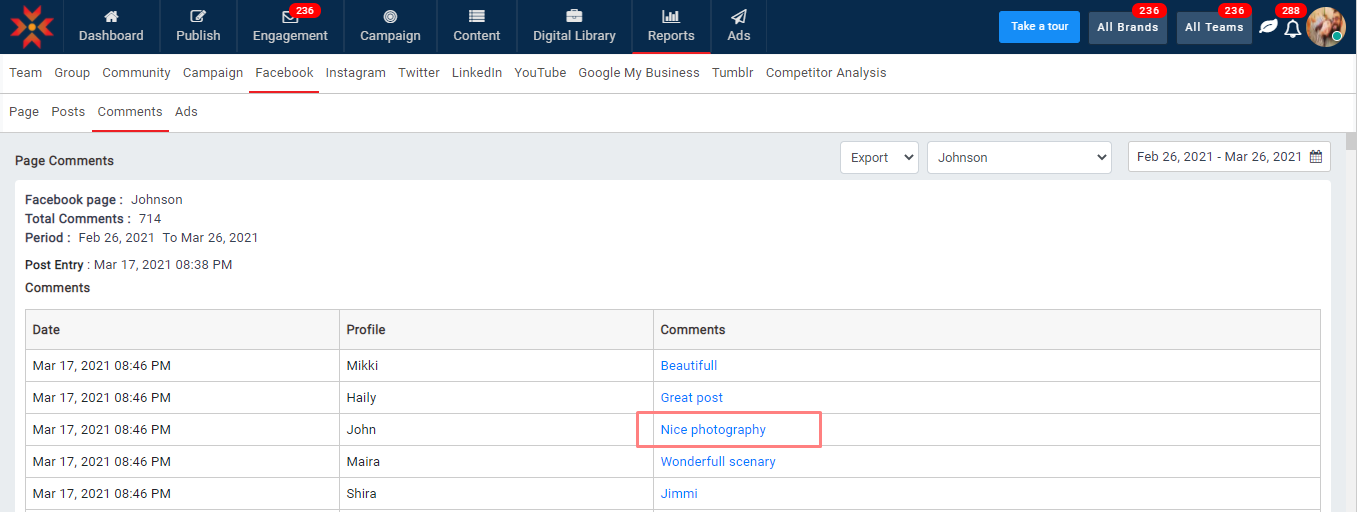
In the Comments Report tab, you can view the details of the comments.
You can click on a comment, and it will show on native Facebook.
Note:
- Only the following languages are supported by the word cloud
- English
- Arabic
- Chinese
- Word cloud image will only be shown in PDF ie, not when exporting to Excel
- The metric (like, comment, share, and reactions) of Cover Picture, Profile Picture and Business hour post, Third Party app related permission posts will not include in the Page, Posts and Comments Reports
Comments
0 comments
Please sign in to leave a comment.